

About Me
I am a dedicated and detail-oriented professional with expertise in advanced tools like Microsoft Excel, PostgreSQL, Power BI, and Python. My approach goes beyond analyzing data—I specialize in transforming it into actionable insights that inspire confident, data-driven decisions. As a data scientist and analyst, I excel at identifying hidden patterns and trends, paired with strong communication skills to present complex information clearly and effectively. Whether it's delivering impactful presentations to stakeholders or streamlining data dissemination within your organization, I bring the expertise and energy to make data truly work for you.
Microsoft Power BI Projects
2024 Mobile Phone Sales & Customer Dashboard
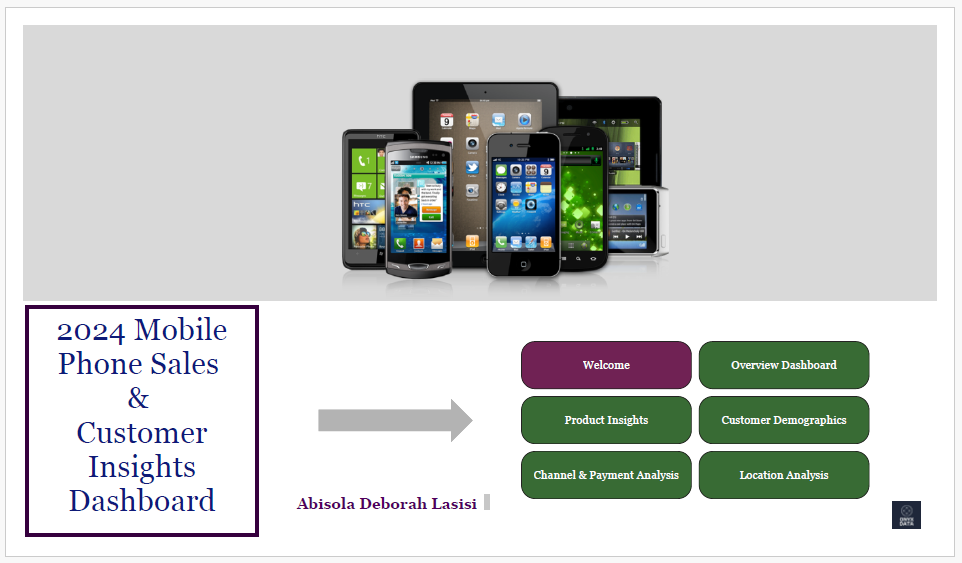
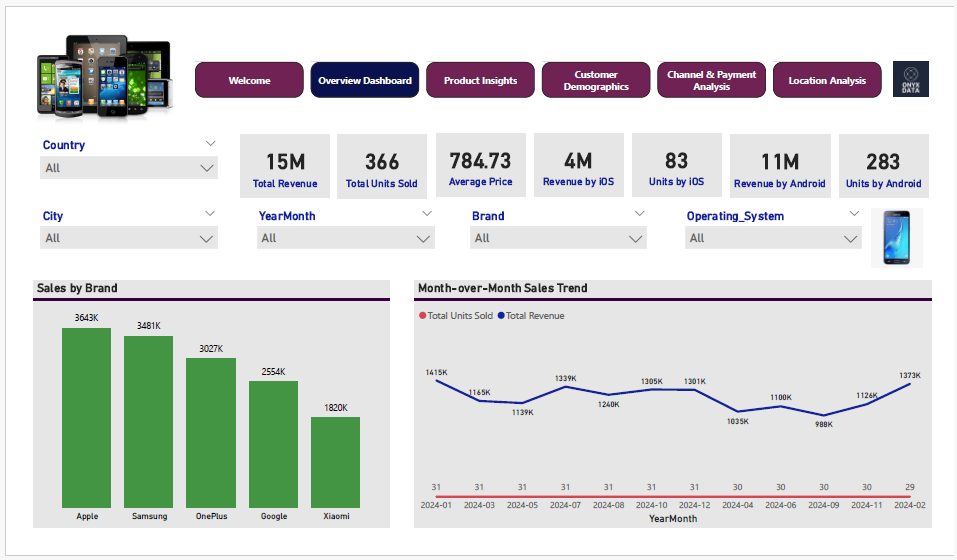
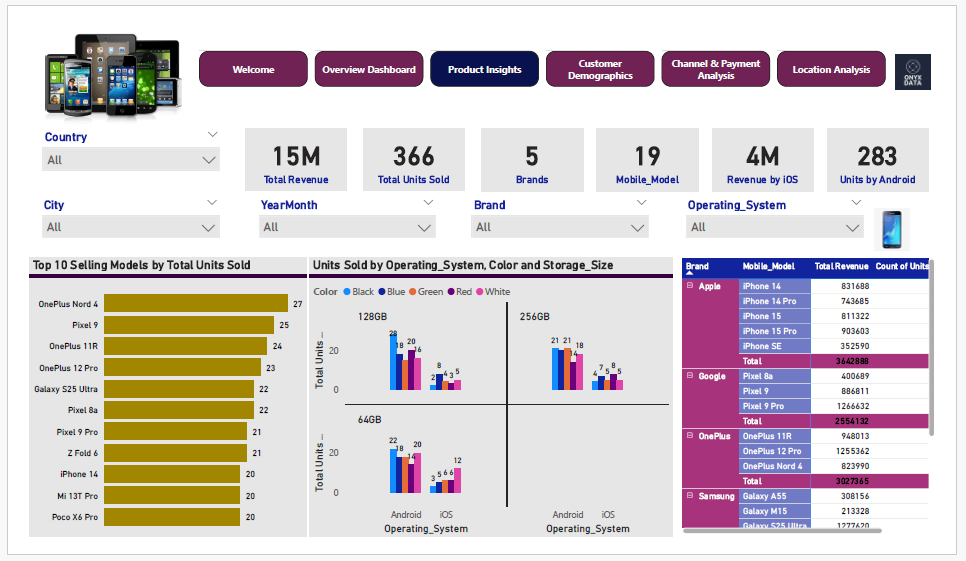
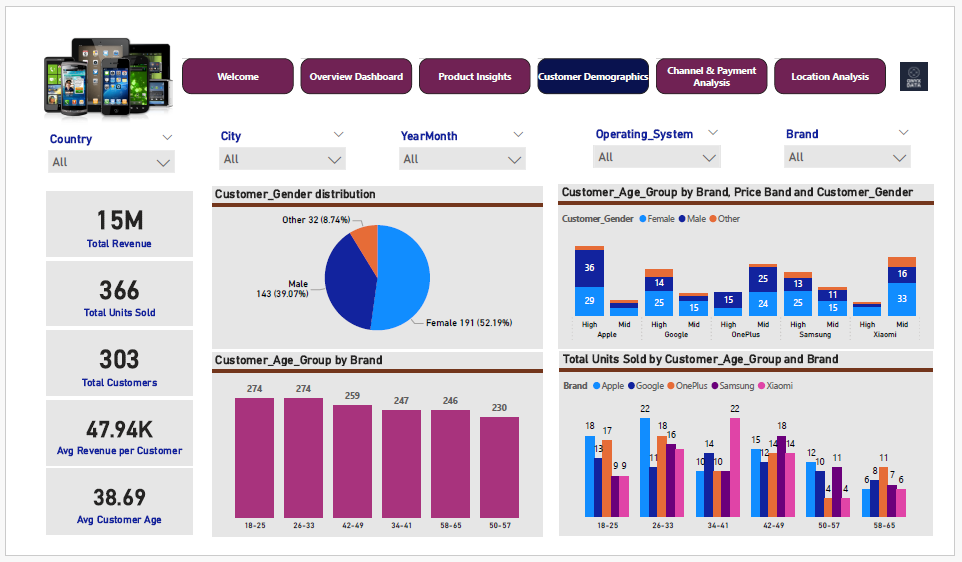
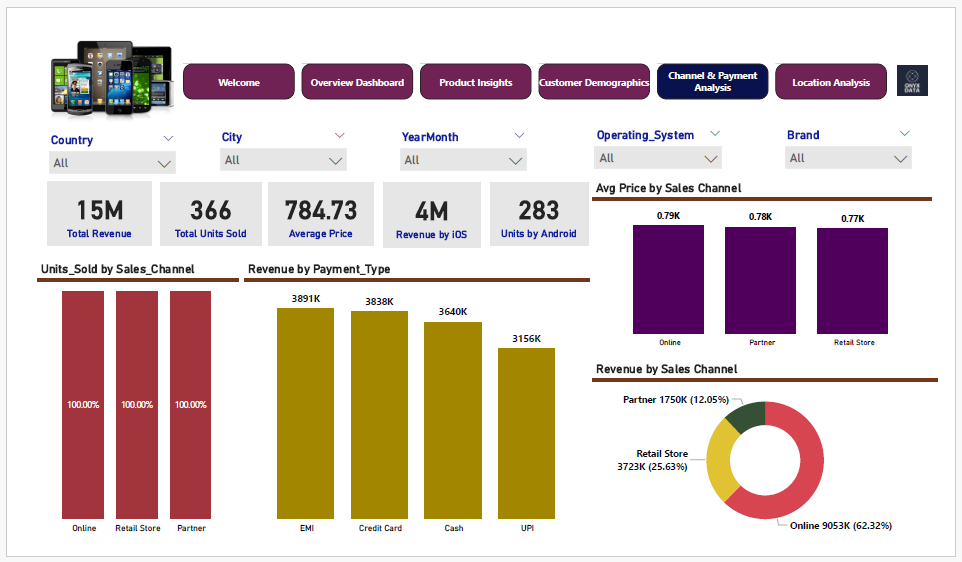
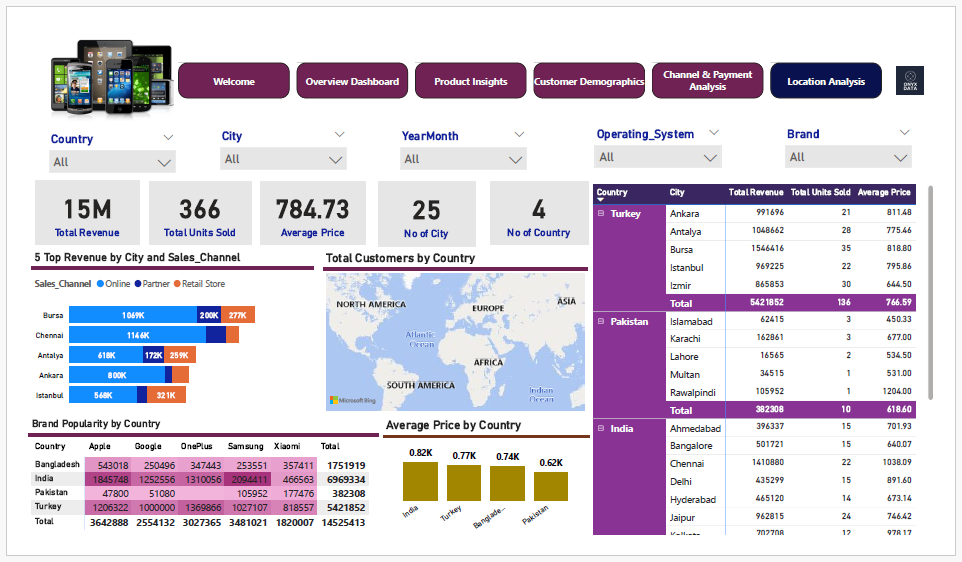
This Dashboard delivers a clear analysis of sales trends and customer demographics, enabling stakeholders to make informed marketing, and product decisions.
Daikibo Telemetry Data Analysis
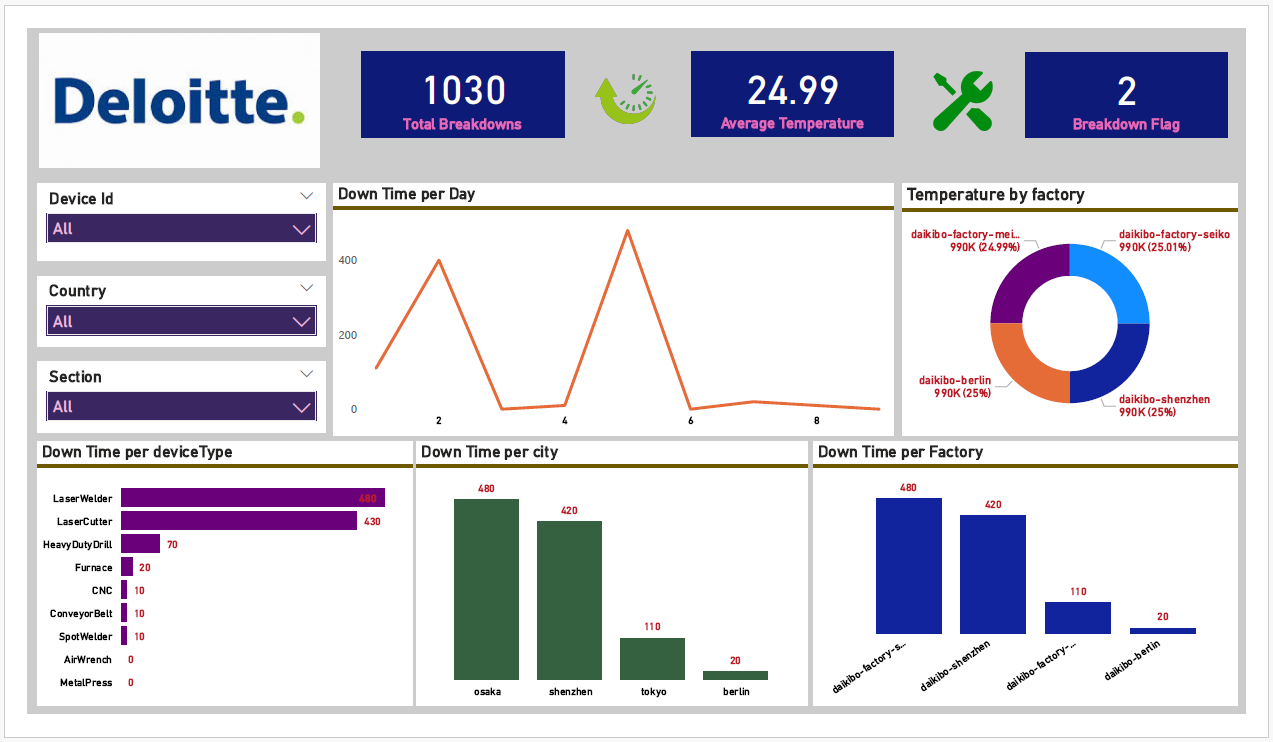
The analysis identified the location with most breakdowns and machines with highest failure rates, offering insights for operational improvements.
Analyzing Job Market Data
The analysis identified key skills for data roles, and Power BI visualizations provided actionable insights for recruitment and talent strategies.
National Hospital Patient Insights.
The visualizations offered insights into product performance, sales trends, and high-performing products, aiding strategic decision-making.
Health Care Analysis - Dec. 2024
This report offers a thorough analysis of healthcare metrics for elective hip replacement surgeries, focusing on LOS and discharge costs across hospitals.
Competitor Sales Analysis - Dec. 2024
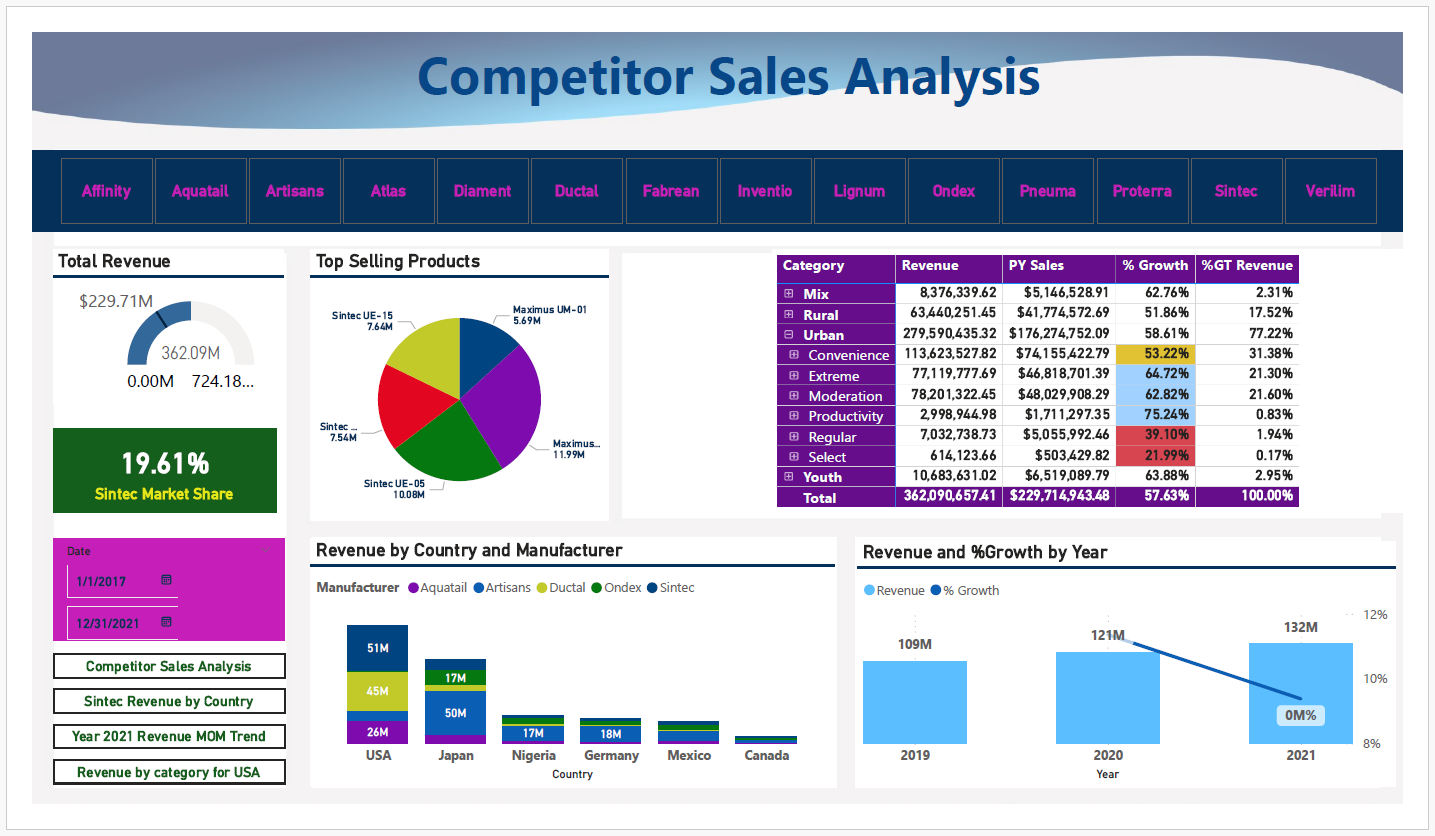
This report evaluate competitor sales performance and uncover actionable insights to enhance revenue, expand market share, and drive sales growth.
Product Sales Dashboard
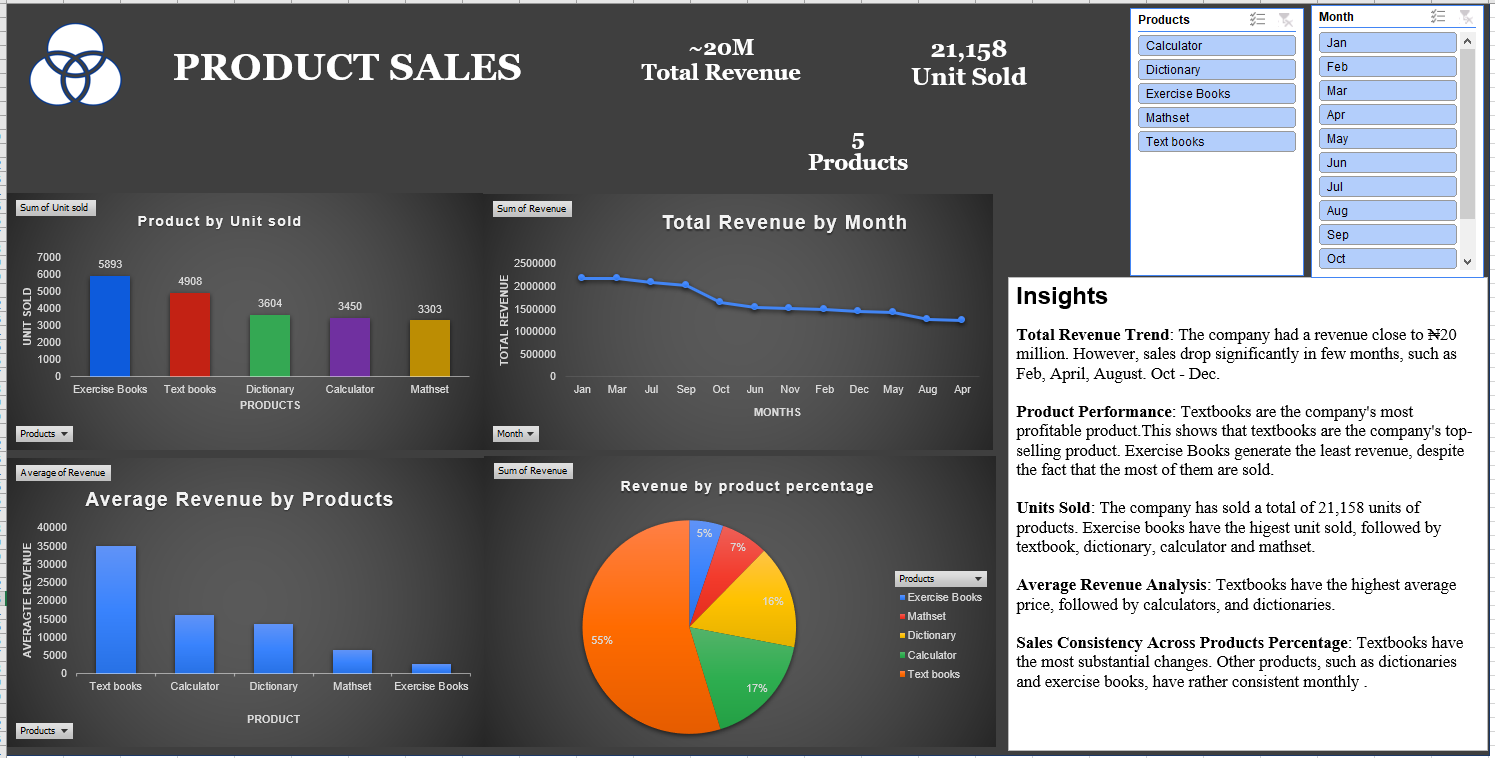
The visualizations offered insights into product performance, sales trends, and high-performing products, aiding strategic decision-making.
Analysis of Investment Preferences

This dashboard analyzes how demographics like age, gender, and goals influence investment choices. It helps uncover trends to improve financial planning.
Health Care Analysis - Dec. 2024

This analysis offers a detailed overview of Netflix, highlighting star and director performance, industry ratings, and box office trends.
PwC Switzerland Power BI Job Simulation


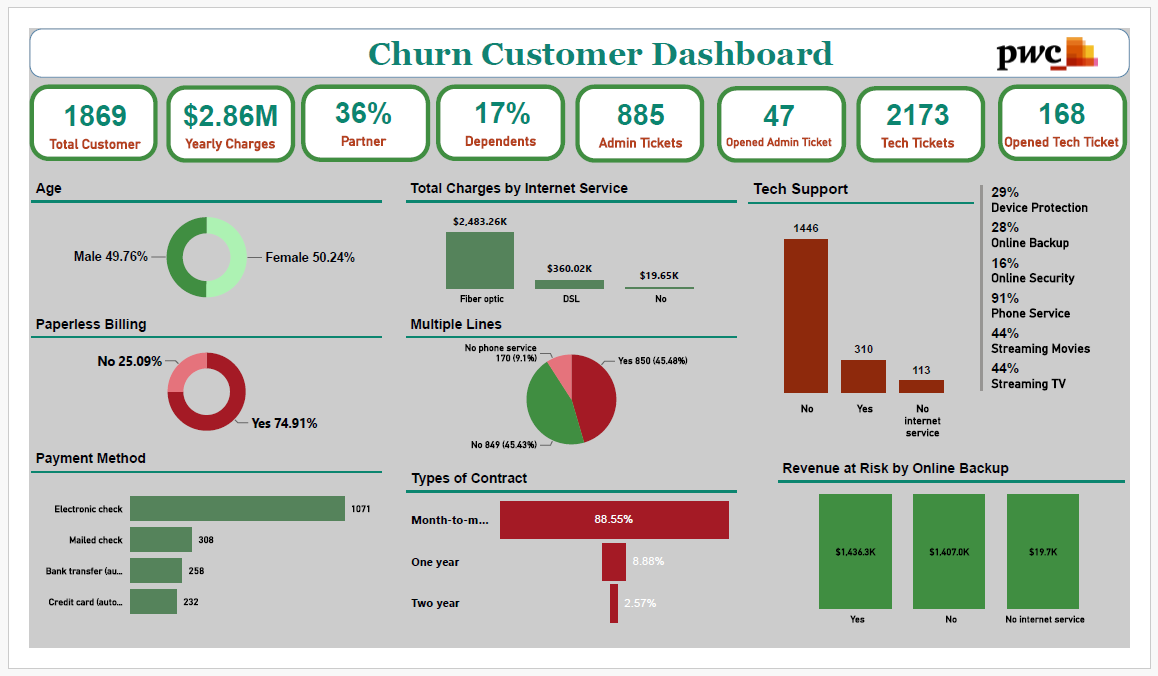
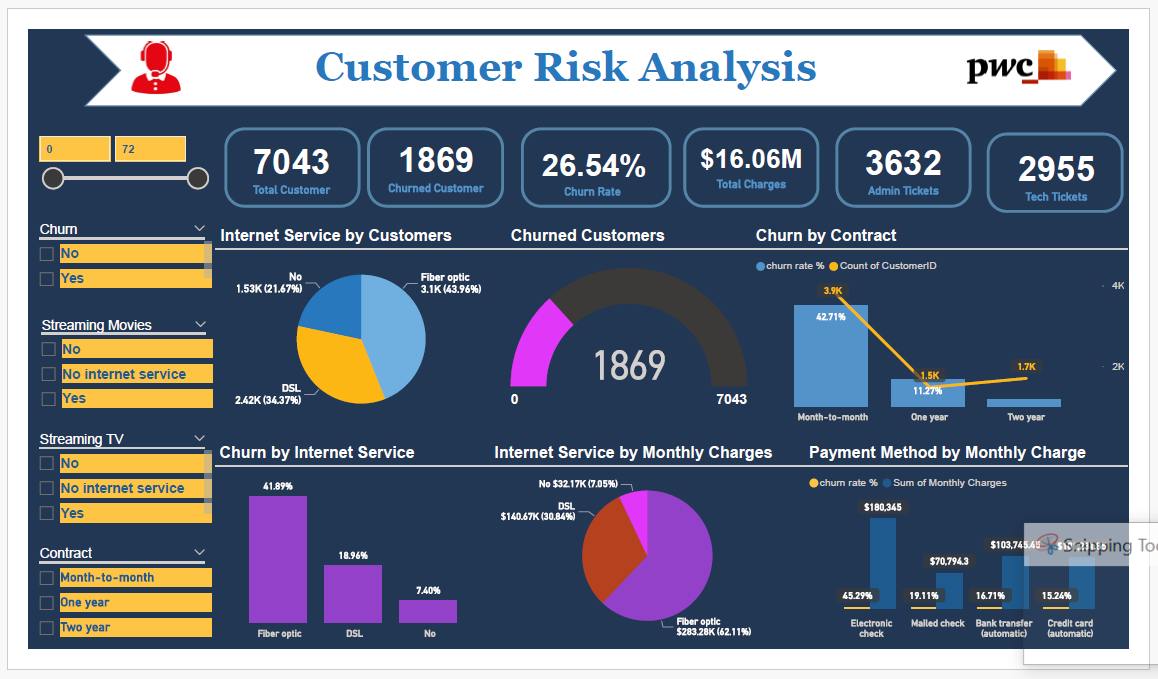
Examine HR data to identify gender-related KPIs and resolve gender balance challenges at the executive management level.
Empowering Business with Effective Insights Job Simulation on Forage
The visualizations offered insights into product performance, sales trends, and high-performing products, aiding strategic decision-making.
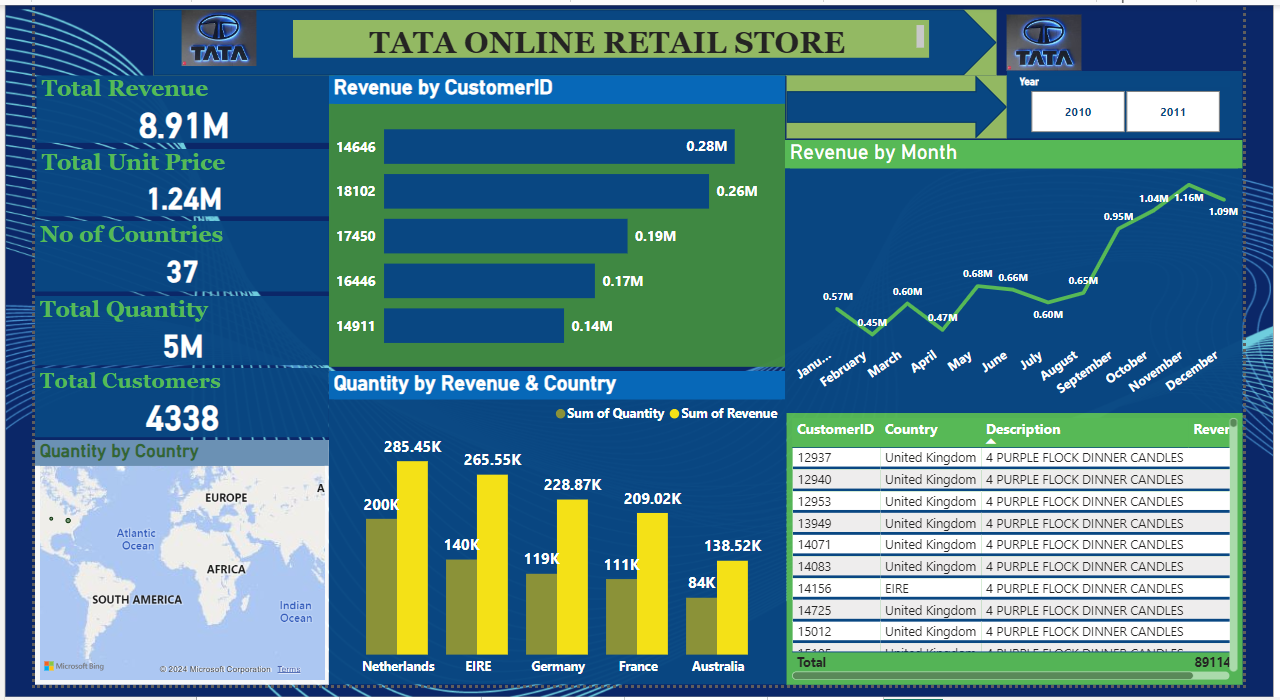
TNMT Retail Sales 2020 Dashboard

The visualizations provided insights into sales dynamics, identifying top products and trends for improved strategic decision-making.
Accenture North America's Data Analytics and Visualization- July. 2024

The analysis highlighted the most popular post categories and trends, providing valuable insights into user behavior and preferences.
DG Limited Sales Report For 2013 & 2014

The visualizations provided insights into sales, profit trends, and projections, aiding informed decision-making for business strategy.
BG Sales Report
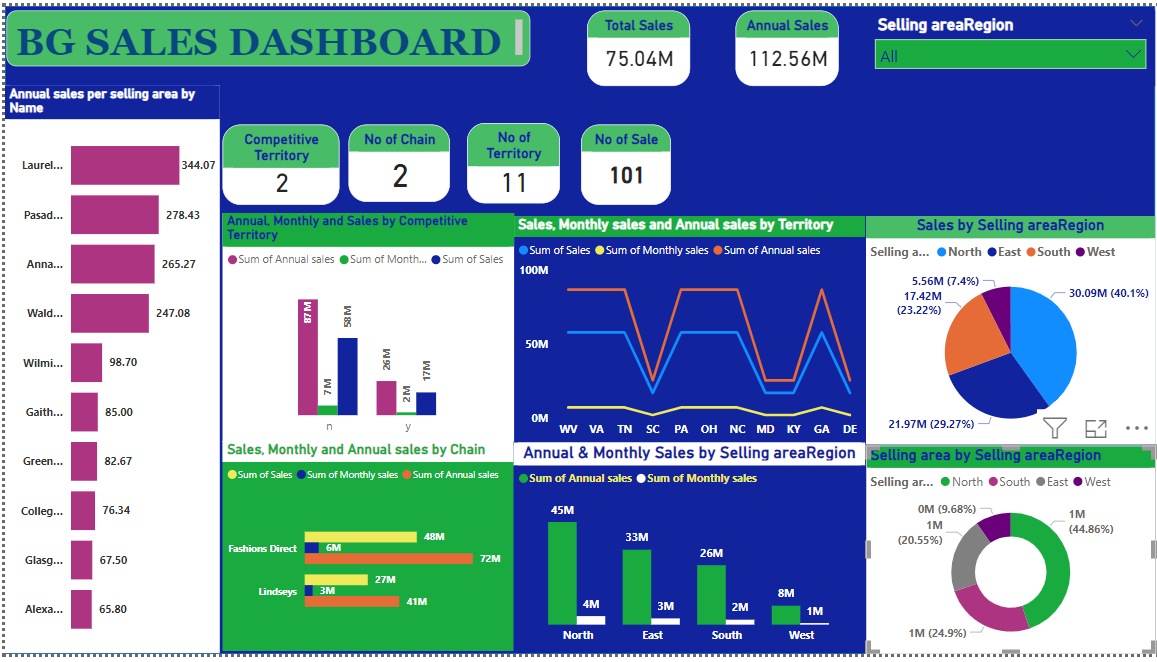
The DAX measures and visualizations revealed critical insights into sales performance, trends, and competition, supporting informed business decision-making.